The Business Cycle Approach to Asset & Sector Allocation
- Sep 10, 2024
- 16 min read
Updated: Sep 11, 2024
By Keith Heng, 1st July 2024
Business cycles are a hallmark of the modern economy. Historically, asset and sector rotations have consistently accompanied cyclical fluctuations in the economy – some more obvious than others. Viewing investing through the lens of business cycles not only provides alpha-capturing opportunities, but also helps to avoid portfolio exposure to cycle risks.
This paper covers business cycle investing extensively, referencing ideas, results, and research conducted by academia and numerous leading asset management firms. Namely – (1) the intuition behind business cycle investing, (2) characteristics of cycle phases, (3) equity sector investing by cycle, (4) asset allocation by cycle, (5) the limitations of a cycle perspective, and (6) economic indicators of cycles – are elaborated on in this paper.
Understanding business cycle investing
Business cycles are fluctuations in the aggregate economic activity of nations that produce far-reaching impacts across economic segments. Historically, these fluctuations are not arbitrary, following certain patterns over time. Most importantly, the performance of financial markets has exhibited conspicuous traits during different business cycles. A powerful example of this – is how by some measures, the consumer discretionary sector has outperformed the broader market during early-stage business cycles 100% of the time.

Note: Relative performance of different sectors in early-stage cycle. As shown by the hit rate – which indicates how often a sector outperforms the broader market – consumer discretionary always outperforms during this particular stage. More details on this study by Fidelity will be explained later.
Source: Fidelity Investments
The implication of this is obvious. If we can understand how financial markets move with business cycles and identify these cycles accurately – portfolio allocations and asset picks can be adjusted to capitalise on business cycles. Most importantly, an appreciation for how markets move with broader economic cycles is relevant to most other investment strategies.
Business Cycle Phases

Note: Characteristics of Fidelity’s four-stage business cycle. Fidelity provides an insightful quarterly assessment of where each major economy is in the four-stage business cycle (link below)
Source: Fidelity Asset Allocation Team
There exists more than one business cycle framework. Here, we use the four-stage growth rate cycle approach – which often provides more granular analysis, is widely used by practitioners (all references in this paper uses this approach) and can be identified using data from leading indicators.
Expand for more detail: The Four Stage Growth Rate Business Cycle
Recovery: Following recessive conditions, the economy recovers sharply. Positive growth in economic activity with increased consumer confidence, aggregate demand, and business spending. Loose monetary policy tends to create an optimal environment for commercial activities.
Expansion: Economy enters the so-called ‘boom’ phase. Strong consumer spending, economic confidence, corporate earnings, low unemployment rate are observed. Inflation and rising interest rates start to kick in, some sectors experience shortages in production factors, and companies invest heavily in expanding business capacities.
Slowdown: Economic growth is positive but slowing. An ‘overheating’ stage where capacity constraints lead to rising inflationary pressures. Monetary tightening usually occurs to taper inflation. Economy output reaches its highest level relative to long-run trends.
Contraction/Recession: During recession, economic activity contracts across most segments. Consumer and business confidence suffers. Employment increases as corporate earnings take a hit. Monetary loosening and even, quantitative easing, could be employed to boost aggregate demand.
For instance, State Street Global Advisors’ (SSGA) research – which we examine later – identifies the 4 cycles using indicators from The Conference Board’s Leading Economic Index (LEI) (more details in Appendix).

Note: Historical fluctuations of the economy through the four-stage business cycle.
Equity sector performance by cycle
Keeping the characteristics of these four stages in mind – we turn to how equity sector performance has varied historically across each phase. Here, we reference — Fidelity's The Business Cycle Approach to Sector Investing & SSGA's Sector Business Cycle Analysis — to illustrate these concepts. To replicate these results, the complete methodologies of each paper can be found in the Appendix.
To provide some essential context, Fidelity Investment uses 3 key metrics for evaluating the performance of each sector relative to the broader equity market:
Expand for description of Fidelity's metrics
Full-phase average performance: Geometric average performance of a sector in a particular phase of the business cycle subtracted by performance of the broader equity market.
Median monthly difference: Difference in the monthly performance of a sector compared with the broader equity market, taken by the midpoint of those observations. This measure is indifferent to when a return period begins during a phase, which makes it a good measure for investors who may miss significant portions of each business cycle phase.
Median monthly difference: Difference in the monthly performance of a sector compared with the broader equity market, taken by the midpoint of those observations. This measure is indifferent to when a return period begins during a phase, which makes it a good measure for investors who may miss significant portions of each business cycle phase.
In the case of State Street Global Advisors, 6 metrics are used to compare each sector:
Expand for description of SSGA's metrics
Average monthly sector return
Average monthly sector excess return over the broad market
Average return of the sector over each business cycle
Average excess return of the sector over each business cycle
Percentage of months when the sector outperformed the broader market
Percentage of cycles when the sector outperformed the broader market
Recovery phase: equity sector performance
The recovery/early-cycle phase is usually marked by easing monetary policy, growing consumer confidence and a recovering labor market. Discretionary spending increases as the economy gains traction while lower rates boost the financials and growth of interest-rate sensitive sectors.

Note: Relative sector performances during the early/recovery phase of business cycle.
Source: Fidelity Investments
By Fidelity's methodology, the consumer discretionary sector outperforms the market in every early-stage cycle since 1962. Debt-heavy sectors like real-estate and growth-focused industries like tech also consistently outperform the market.
Interestingly, while consumer discretionary has the highest geometric average, its median difference returns is less than that of financials and real estate. This could imply that while consumer discretionary more consistently outperforms the market, less consistent sectors like real estate could outperform by a greater extent when they do beat the market.
On the other hand, defensive sectors like consumer staples, healthcare and utilities tend to trail the market as they have relatively consistent demand and financials across different cycles. The effect of a 'recovering' economy could be less conspicuous in such industries and investors might prefer cyclical sectors to capture market upturns.

Note: Relative sector performances during the early/recovery phase of business cycle.
Source: State Street Global Advisors
This result is mostly echoed by SSGA's research. Interestingly, SSGA also provides hit rate for % of months that sector outperform the market. This can be important as in practice, identifying the current or subsequent business cycle is not a trivial task, often creating timing lags in trying to capture cycle profits.
Consumer discretionary, real estate, technology and materials continue to lead the market while defensive industries lag behind. Notably, consumer discretionary still has the highest hit rates while real estate has the highest average monthly returns.
Expansion phase: equity sector performance
The expansion/mid-cycle phase is marked by poor sector-performance differentiation. The leadership of interest rate-sensitive industries falter as the economy moves beyond initial recovery. This is not only the longest phase historically, but also where significant market corrections and sector leadership rotations happen.

Note: Relative sector performances during the early/recovery phase of business cycle.
Source: Fidelity Investments
As seen by Fidelity's results, no there is no sector that outperforms the market consistently during this period, with hit rates at best slightly over 50% and most often below that level. Historically, tech and communication services have performed better during this phase. However, with performance during this phase largely resulting from other non-related business factors — such results are unlikely to be persistent or of much use moving into the future. Underperformance however, is more consistent and largely concentrated in the materials and utilities sectors.
With that being said, sector bets are probably less relevant in this phase, giving way to other approaches such as bottom-up value investing.

Note: Relative sector performances during the early/recovery phase of business cycle.
Source: State Street Global Advisors
The same effect can be noticed in SSGA's results, where the magnitude of average monthly excess returns of the best performing industries are much more muted compared to the early-stage phase. Industries that perform the best include technology and financials while non-cyclical sectors continue to trail the market.
Slowdown phase: equity sector performance
The slowdown/late-cycle phase is where economic growth starts to decelerate, inflationary pressures build and growth experiences mounting challenges. Signs of economic slowdown start to show, economic confidence falters and investors flock into safer havens.

Note: Relative sector performances during the early/recovery phase of business cycle.
Source: Fidelity Investments
Consequently, as shown by Fidelity's results, there is a reversal of fortunes where defensive, non-cyclical sectors like consumer staples and utilities lead the market. The energy sector has also historically performed well during this phase. On the other hand, discretionary sectors like tech and consumer discretionary lag the market as profit margins are squeezed and investors move away from these industries.

Note: Relative sector performances during the early/recovery phase of business cycle.
Source: State Street Global Advisors
Similarly, SSGA's results show defensive sectors like consumer staples and healthcare leading the market. Industrials also performs relatively well, tending to benefit from increasing investment in capital products.
Recession phase: equity sector performance
The recession phase is historically the shortest. Naturally, the broader market performs poorly as a whole during this phase. Economic growth contracts, consumer confidence is poor and investments flock to defensively oriented industries. These sectors usually provide more essential goods and services, experiencing stable demand and profits even in the midst of a recession.

Note: Relative sector performances during the early/recovery phase of business cycle.
Source: Fidelity Investments
Consumer staples outperform the market 100% of the time during recessions as measured by Fidelity's methods. This is a logical mirror to consumer discretionary, which similarly outperforms 100% of the time, but in the early-stage cycle. Other defensive sectors like utilities and healthcare also outperform the market significantly.
On the other hand, sectors that lead the market during economic recovery are also the hardest hit during recession. Sectors such as tech, real estate and communication services experience more than -5% geometric average during this period.

Note: Relative sector performances during the early/recovery phase of business cycle.
Source: State Street Global Advisors
Similarly in SSGA's research, non-cyclical sectors on average outperform the broader market by more than 10% in almost all recession periods. Notably, all sectors have negative average returns but consumer staples, energy and utilities lose the least ground compared to other industries.
Asset Allocation by Cycle
Beyond equity sector allocations, general asset allocations are also affected by business cycles. Fidelity's — The Business Cycle Approach to Asset Allocation — and Vanguard's — Investing Through the Economic Cycle — provide a similar perspective on this matter.
Generally, equities lead the way during the economic recovery/early-stage and expansion/mid-stage phases. Favourable business climate, strong economic confidence and robust growth rates all provide room for the stock market to outpace defensive assets.
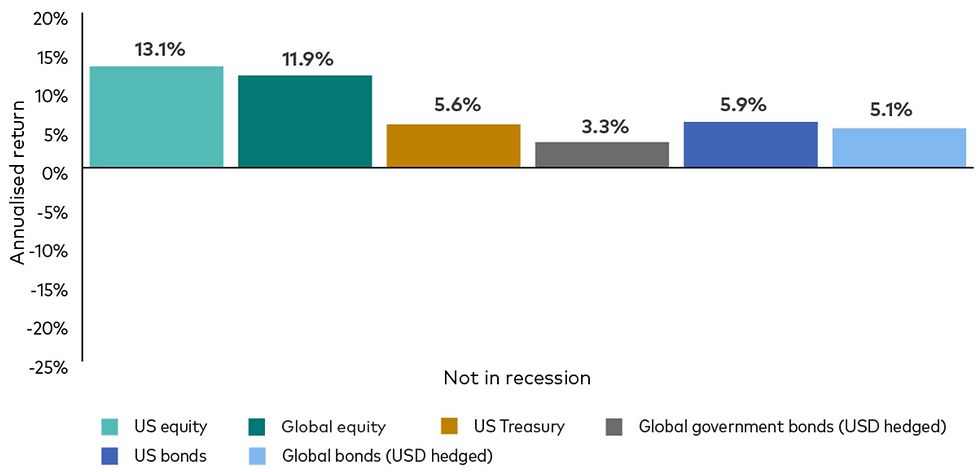
Note: US equity and global equity significantly outperform various classes of bonds during non-recessive periods.
Source: Vanguard
On the contrary, the various bond classes tend to outperform during economic slowdown/late-stage and recessive periods. During these stages, the stock market performs poorly as a whole. Cash plays a defensive role while falling interest rates that usually accompany easing monetary policy to stimulate the economy provides added tailwind for bonds.

Note: US equity and global equity significantly outperform various classes of bonds during non-recessive periods.
Source: Vanguard
The performance of individual asset classes as compared to a 50% stocks, 40% bonds and 10% cash benchmark portfolio can be observed in Fidelity's results below.

Note: Similar to Vanguard's results, stocks outperform during early and mid cycles while bonds and cash perform well during recessions. These differences are muted during the slowdown/late-cycle stage.
Source: Fidelity Investments
Limitations of the Business Cycle Perspective
Like all other approaches, investing using a business cycle approach also has its flaws.
Firstly, business cycles are not homogenous across different markets and countries. Globalisation has inherently integrated different markets and at any point of time, the effects of domestic business cycles could be exacerbated or lessened by economic developments in other countries or regions. For instance, given the fungible nature of oil its highly connected markets, energy firms' profits and performances are more driven by regional or global oil demand and supply than their domestic business cycles.
Secondly, idiosyncratic events often prevail over business cycle effects. One example is how metal and mining stocks fell by 21% in the late 90's in the US despite the economy being in full expansion. As it turned out, the Asian financial crisis reduced Asia's demand for metals and mining products, which caused metal exporters like Russia to channel their excess metal to the US, which was less affected by the crisis. This caused metal prices to drop by 25%, negating any of the positive effects that expansion stages tend to have on metal and mining companies.

Note: Idiosyncratic events can, and have often prevailed over general business cycle trends.
Source: State Street Global Advisors
Thirdly, trends that have been observed over business cycles in the past are continuously evolving and might not persist into future cycles. For instance, throughout this paper, utilities has been shown to outperform during recessive conditions and underperform during growth cycles due to their defensive nature. However, is this still true for future cycles to come?

Note: Constellation Energy Corp stock price. The AI boom has disrupted a traditionally 'defensive' industry.
Source: Bloomberg
Over the past year, the AI craze has caused subsegments of the utilities industry that are expected to profit from the spike in data centre energy consumption to rally. Constellation Energy Corp for instance, started the year at $115.25 USD but rocketed to a high of $231.27 USD in end May. Needless to say, AI expectations are now priced into these specific stocks and they ride along the same wave as many other AI related industries. Thus, the impact of business cycles on sectors are constantly evolving and critical evaluation must prevail over blind faith in past trends.
Economic Indicators
Although this article predominantly focuses on the effects of business cycles, being able to identify the ongoing cycle or forecast upcoming cycles is as important as understanding what goes on in the cycle itself. After all, history does not repeat itself randomly.
Leading indicators have turning points that usually precede those of the overall economy; they are believed to have value for predicting the economy’s future state, usually near-term.
Expand for examples of leading indicators
Stock Market
The stock market is often seen as a forward-looking mechanism. Investors make decisions based on their expectations of future corporate earnings and economic growth. A rising stock market can indicate investor confidence in economic expansion, while a falling market may signal expectations of economic downturns.
Average weekly hours for manufacturing
Employers tend to increase or reduce work hours before committing to costlier headcount increase or layoffs to fulfil initial changes in demand for firm's output. Thus, average weekly hours (manufacturing) may signal expectations of business growth or contraction.
Retail Sales
Rising retail sales typically suggest that consumers are confident in the economy and willing to spend money, which boosts production, employment, and income. Since consumer spending tends to be one of the first things to change when economic conditions shift, retail sales are a key leading indicator of future economic growth or contraction.
Coincident indicators have turning points that are usually close to those of the overall economy; they are believed to have value for identifying the economy’s present state.
Expand for examples of coincident indicators
Industrial Production Index
This index measures the output of the industrial sector, including manufacturing, mining, and utilities. Since industrial production tends to fluctuate with the broader economy, an increase in production reflects economic expansion, while a decrease suggests a slowdown. Industrial output directly correlates with real-time economic activity, making it a reliable indicator of the current economic condition.
Real Personal Incomes
Real personal income measures the income individuals earn, adjusted for inflation. When the economy is strong, people tend to earn more, and during economic downturns, incomes may stagnate or fall. Since changes in personal incomes occur alongside changes in economic activity—impacting consumer spending and demand—this indicator provides a real-time snapshot of the economy’s current health.
Manufacturing & Trade Sales
This indicator tracks the sales of goods produced by manufacturers and the trade sector, which includes wholesale and retail. Sales in these sectors directly reflect the level of economic demand. As the economy grows, sales typically increase, and as it contracts, sales decline. Because these sales data align with the broader economic performance at a given point in time, they serve as a coincident indicator.
Lagging indicators have turning points that take place later than those of the overall economy; they are believed to have value in identifying the economy’s past condition.
Expand for examples of lagging indicators
Inflation
Inflation measures the general increase in prices over time. It tends to lag behind economic activity because prices adjust after changes in demand and supply have already occurred. For example, during an economic expansion, consumer demand increases, but it takes time for this increased demand to cause upward pressure on prices. Similarly, in a recession, demand decreases first, and inflation may only decline afterward as businesses adjust their prices. Inflation reflects past economic activity rather than predicting future changes.
Average Prime Lending Rate
The prime lending rate is the interest rate that banks charge their most creditworthy customers, which typically changes in response to central bank policies (like the Federal Reserve in the U.S.) aimed at controlling inflation or stimulating the economy. Central banks tend to adjust interest rates only after economic trends are clear. For example, in a growing economy, central banks may raise interest rates to prevent overheating and control inflation, but this happens after the economy has already shown strong growth. As a result, changes in the prime lending rate lag behind the economic cycle.
Ratio of Consumer Instalment Debt to Income
This ratio reflects how much debt households have in relation to their income, focusing on installment debt like car loans or mortgages. It lags because consumers typically borrow more during economic expansions and repay or reduce borrowing during downturns. However, changes in debt levels tend to happen after the economic conditions that prompted them have already shifted. For example, after a recession hits and incomes fall, consumers may struggle to pay off existing debts, but the debt-to-income ratio rises only after the economic downturn is underway.
Put together, they form a set of indicators that could help us to gauge the past, current and future business cycles.
Conclusion
Business cycles provide an insightful approach to asset and sector allocation. By making accurate judgements of current or impending business cycles, similar past cycles can be analysed to strategically allocate portfolios to assets and sectors that thrive best in different economic scenarios.
However, critical judgement should always prevail over careless faith that history will simply repeat itself. Domestic business cycles always act in tandem with numerous other regional/global developments and the relationship of each sector with the economy is always evolving.
When rigorously evaluated and applied in conjunction with other approaches such as bottom-up analysis of individual stock picks or macro-fundamental analysis of specific industry dynamics — a business cycle perspective can meaningfully enhance and improve investment performance.
Appendix
Ten Economic Indicators of the Leading Economic Index (LEI)
Average weekly hours, manufacturing
Average weekly initial claims for unemployment insurance
Manufacturers’ new orders, consumer goods and materials
ISM Index of new orders
Manufacturers’ new orders, nondefense capital goods, excluding aircraft orders
Building permits, new private housing units
Stock prices, 500 common stocks
Leading Credit IndexTM
Interest rate spread, 10-year Treasury bonds less federal funds
Average consumer expectations for business conditions
SSGA Paper Methodology
Although Global Industry Classification Standard (GICS) sector classification has become widely recognized and tracked by market participants, its performance history is limited, going back to only 1989 and covering only three recessions. To get a comprehensive account of sector performance over multiple business cycles, SSGA leverags the performance data of Kenneth French 48 SIC-based (Standard Industrial Classification) industry portfolios based on the latest GICS sector definitions. SSGA then equally weight industry performance to create a longer sector performance history that covers seven recession and recovery periods, 12 expansions and 11 slowdowns.
In order to fully evaluate sector performance over business cycles, SSGA assesses how well the sector performed and how consistent the performance is in each type of cycle by using the following six metrics: 1 Average monthly sector return 2 Average monthly sector excess return over the broad market 3 Average return of the sector over each business cycle 4 Average excess return of the sector over each business cycle 5 Percentage of months when the sector outperformed the broader market 6 Percentage of cycles when the sector outperformed the broader market. SSGA then calculates the sector z-scores based on these metrics to standardise results across all sectors and allow for easy comparison. Next, a composite score is calculated by equally weighting each metric to identify top and bottom three sectors for each business cycle.
SIC Sector and GICS Sector Mapping

Fidelity Paper Methodology
The S&P 500 index is a market capitalisation-weighted index of 500 common stocks chosen for market size, liquidity, and industry group representation to represent U.S. equity performance. The Russell 1000 Index is a stock market index that represents the highest-ranking 1,000 stocks in the Russell 3000 Index, which represents about 90% of the total market capitalisation of that index.
Sectors and industries are defined by the Global Industry Classification Standard (GICS). The S&P 500 sector indexes include the 11 standard GICS sectors that make up the S&P 500® index. The market capitalisation of all S&P 500 sector indexes together comprises the market capitalisation of the parent S&P 500 index; each member of the S&P 500 index is assigned to one (and only one) sector.
Sectors are defined as follows:
Communication Services: companies that facilitate communication or provide access to entertainment content and other information through various types of media.
Consumer Discretionary: companies that provide goods and services that people want but don’t necessarily need, such as televisions, cars, and sporting goods; these businesses tend to be the most sensitive to economic cycles.
Consumer Staples: companies that provide goods and services that people use on a daily basis, like food, household products, and personal-care products; these businesses tend to be less sensitive to economic cycles.
Energy: companies whose businesses are dominated by either of the following activities: the construction or provision of oil rigs, drilling equipment, or other energy-related services and equipment, including seismic data collection; or the exploration, production, marketing, refining, and/or transportation of oil and gas products, coal, and consumable fuels. Financials: companies involved in activities such as banking, consumer finance, investment banking and brokerage, asset management, and insurance and investments.
Health Care: companies in two main industry groups: health care equipment suppliers and manufacturers, and providers of health care services; and companies involved in the research, development, production, and marketing of pharmaceuticals and biotechnology products.
Industrials: companies whose businesses manufacture and distribute capital goods, provide commercial services and supplies, or provide transportation services.
Materials: companies that are engaged in a wide range of commodity-related manufacturing.
Real Estate: companies in two main industry groups—real estate investment trusts (REITs), and real estate management and development companies.
Technology: companies in technology software and services and technology hardware and equipment.
Utilities: companies considered to be electric, gas, or water utilities, or companies that operate as independent producers and/or distributors of power.
Full-phase average performance: Calculates the (geometric) average performance of a sector in a particular phase of the business cycle, and subtracts the performance of the broader equity market. This method better captures the impact of compounding and performance that is experienced across full market cycles (i.e., longer holding periods). However, performance outliers carry greater weight and can skew results.
Median monthly difference: Calculates the difference in the monthly performance of a sector compared with the broader equity market, and then takes the midpoint of those observations. This measure is indifferent to when a return period begins during a phase, which makes it a good measure for investors who may miss significant portions of each business cycle phase. This method mutes the extreme performance differences of outliers, and also underemphasises the impact of compounding returns.
Cycle hit rate: Calculates the frequency of a sector’s outperforming the broader equity market over each business cycle phase since 1962. This measure represents the consistency of sector performance relative to the broader market over different cycles, removing the possibility that outsized gains during one period in history influence overall averages. This method suffers somewhat from small sample sizes, with only eight full cycles during the period, but persistent out- or underperformance still can be observed.


Comments