Fed in 2024: The Past, Present & Future
- Aug 3, 2024
- 9 min read
By Keith Heng, 14th June 2024
As the Fed embarks on a new phase of cautious rate cuts, it is a fitting time to revisit its colourful history, its present workings & what lies ahead.
Fed pencils in 1 rate cut, affirms latest data as ‘encouraging’
Federal reserve officials announced on Wednesday that interest rates would remain unchanged at 5.25% to 5.50%, with only one cut expected this year. While this was a dial back from the three cuts previously expressed in March, it nonetheless affirmed – along with a slew of improving economic indicators – that the Fed will soon transition to a phase of lowering long term rates.

Note: Target rate as of June 12, 2024, with midpoint of the Federal Reserve’s target range used. Shaded areas indicate recession.
Source: Federal Reserve Bank of New York
After 1.5 years of hiked interest rates to curb spiraling inflation and prices, the market is eager to pounce on good news. When and how – these rate cuts come however, ultimately depend on whether the Fed is convinced the economy is ready for it. For now, there are promising signs of inflation cooling and employment robustness, but Fed officials await more conclusive results. Before discussing outlooks for the coming transition, it is an opportune moment to revisit how this paramount institution works and the key moments since its inception.
The Dual Mandate
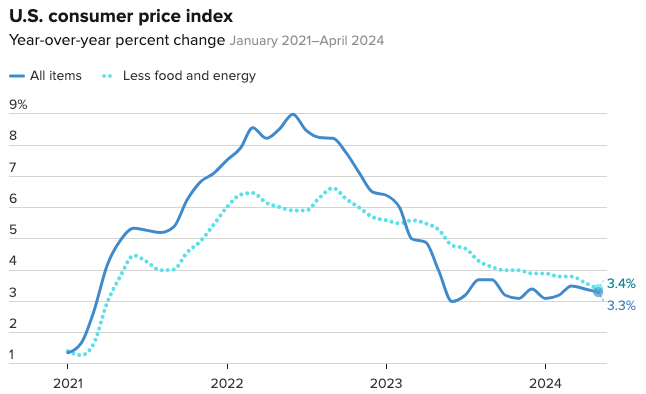
The Fed revolves its monetary policies around 2 key objectives – price stability and maximum employment. Price stability refers to low and stable inflation, which in 2012 was quantified as 2% over the longer run by the Federal Open Market Committee (FOMC).
Many economists believe that steady, low inflation provides a good mix of predictability and flexibility for households and businesses to make decisions contributing to a favourable economic climate. On the other hand, high inflation or even, deflation alarms central banks. The former erodes purchasing power, disproportionately impacts lower-income segments and might spiral dangerously while the latter is usually accompanied by periods of economic tribulation.

Note: The Consumer Price Index (CPI) measuring % change in price of a basket of goods & services by households is a key inflation metric. The heightened inflation of 2022 that prompted the Fed to hike rates can be observed.
Source: Federal Reserve Bank of New York
In the short run, these two goals are often complimentary, such as in the case of demand shocks. But there are times where they are at odds. For instance, supply shocks in the form of oil price spikes could increase both inflation and unemployment. Policies to bring down employment could push inflation even higher, and vice-versa.
In such cases, Fed responses could be less telling, often having to carefully weigh the ‘different time horizons’ that each objective operates in. In 2022 however, with remarkably low unemployment rates but inflation at its peak in four decades, there was clear consensus on forceful monetary policy tightening.
Federal Fund Rate
We’ve all heard about the Fed ‘setting interest rates’. But what this really refers to – is a two-step monetary policy process. Firstly, the FOMC sets the ‘target federal fund rate range’, the target range (5.25% to 5.50% now) at which commercial banks borrow and lend their excess reserves to each other overnight. But banks do not magically follow this target. This is where – in the second step – the Fed utilizes its vast monetary toolkit to coerce market rates to align with this target.

Note: The process of ‘setting interest rates’ to pursue the dual mandate.
The Fed ‘Toolkit’
The 4 key monetary tools used by the Fed to influence rates are the (1) Interest Rate on Reserve Balances (IORB rate), (2) Overnight Reverse Repurchase Agreement Facility, (3) Federal Discount Rate, and its (4) Open Market Operations.

Note: The target federal fund rate range is enforced through the Fed’s administered rates. Note how the discount rate enforces the ‘ceiling’ while the IORB & ON RRP rate enforces the ‘floor’.
Interest on reserve balances (IORB rate) refer to interest paid on funds that banks hold in their reserve balance accounts at their Federal Reserve Bank. Since this interest is risk-free, it forms the ‘reservation rate’ – which is the lowest rate at which banks would be willing to lend out these funds instead of just leaving it with the Fed.
However, only Fed member banks can earn the IORB rate. Thus, the Fed provides the Overnight Reverse Repurchase Agreement Facility (ON RRP rate) to a broader set of market players. Together with the IORB rate, this enforces the ‘floor’ of the target fed fund rate – since the market has little reason to lend at lower rates than what they can earn from the Fed.
The ’ceiling’ on the other hand – is established by the discount rate, which is the interest rate that depository institutions can lend from the Fed itself. Since it makes little sense for banks to borrow at higher rates elsewhere than from the Fed, the discount rate enforces the upper ‘ceiling’ of the target fed fund rate.
Lastly, the Fed also conducts Open Market Operations – by buying and selling government securities. For instance, if the FOMC wants to cut rates, Fed trading desks might purchase Treasury bonds from member banks to inject money into their reserve balances. This increases the funds available for lending, putting downward pressure on interest rates.
Effects of Fed Rate Hikes
Upon enforcing the target rates through its monetary tools, a broad range of effects ripple through the economy. Higher rates make borrowing more expensive. From adjustable-rate mortgages (ARMs) to credit card annual percentage rates (APRs) and home equity line of credit (HELOC) rates – those who can no longer afford the higher borrowing costs postpone their expenditure. The reduction in money circulation could lower inflation and ‘cool the economy’.

Note: The S&P 500 Index hit a bottom in October 2022, during a bear market triggered by drastic Fed rate hikes to tame runaway inflation
Source: Bloomberg L.P.
Higher market rates can also impact stock markets. With higher borrowing costs, business financials and growth rates are impacted, potentially impacting stock prices. For instance, just as I am writing this article, the S&P 500 has just risen 0.9% to a record-high of 5,421.03 in response to the latest Fed meeting and positive inflation data.
On the other hand, drastic rate hikes in 2022 contributed in part, to events such as the ghastly 649% increase in tech layoffs in the same year. Fed decisions not only affect actual economic conditions – but also influence market psychology and economic sentiment.

Note: Bonds are amongst many other things, affected by interest rates. The St Louis Fed site provides an incredible (and free) feature to visualise the relationship of many different rates in their database.
Bonds are also sensitive to interest rate changes. The price of existing bonds generally falls when interest rates increase, as newly issued bonds have rising yields. Long-term bonds tend to be more sensitive to such changes than short-term bonds.

Note: US Savings & CD yields obtained through surveys from more than 500 banks and credit unions to compile national averages
The ‘brighter’ side of higher rates is that while they dissuade borrowing and expenditure, saving is now more attractive. The fed fund rate serves as a benchmark for deposit account annual percentage yields (APYs). This improves earnings on savings accounts, checking accounts, certificates of deposit (CDs) and money market accounts.
Key Historic Moments

Note: Effective fed fund rates reached historic highs in 1980 and plummeted to 0% in 2008 and 2020
Fed history is fraught with countless significant events. Two periods worth careful examination, however, would be the historically high rates of the 80’s and the first time rates plummeted to 0% in 2008.

Note: ‘The Great Inflation’ which peaked in 1980 reached incredulous double digits, prompting extreme monetary tightening. Note how 2022 inflation levels were the highest we’ve seen since then.
The most recent rates hike of 2022, where inflation hit a 40-year record high was a throwback to ‘The Great Inflation’ which lasted from 1965 to 1982. Caused by a wide range of issues – ranging from the Vietnam War to the gold standard termination and oil price shocks of the 70’s – inflation hit a stunning 12.5% in 1980. In response, the fed fund rate skyrocketed to 20% in December 1980, causing 2 recessions in rapid succession.

Note: Monetary loosening was executed too early in 1980, leading to a subsequent rollercoaster in interest rates as the economy failed to really ‘cool down’.
Although ‘The Great Inflation’ happened in a vastly different economic era, important insights from then are still echoed today. Just as the S&P 500 lost more than 27% in 1980, we’ve seen our own version of a 20% drop in the S&P 500 in the first half of 2022.
Today, many criticise Powell for being overly conservative, pointing out that monetary loosening should have already happened. Perhaps, if we look at the disastrous premature loosening in 1980, which saw interest rates fall from 19.39% in April 1980 to 9% in July, only to rocket back to 19% in Jan 1981 as inflation surged again – it will not be too hard where the Fed is coming from.

Note: In response to the 2008 financial crisis, effective fed fund rates dropped close to 0% to stimulate the economy. The lacklustre effect this had on economic growth led the Fed to adopt quantitative easing, changing financial history.
Amidst the Great Recession, the FOMC lowered its target rate sharply, all the way to 0% in November 2008. Despite this, economic growth was pale, averaging about 2% in the first four years of recovery. Worse, unemployment rates remained at historically elevated levels. There was a clear dilemma. Rates were already at zero. What more could the Fed do?
This led to the first time Quantitative Easing (QE) was deployed in the US. By making large-scale asset purchases, the Fed aims to increase money in circulation, helping lower longer-term rates and borrowing costs, spurring economic growth.
In 3 different rounds, the Fed purchased more than $4 trillion worth of assets between 2009 and 2014. To this day, QE remains a subject of debate. While most economists affirm the positive effects it has had in post-2008 US, many have also pointed out how QE might lead to effects such as inflation, asset bubbles or income inequality.
Note: The first three QE rounds from 2009 to 2014 expanded the Fed balance sheet to unprecedented levels. QE4 was initiated in March 2020 in response to the Covid-19 pandemic.
US-led QE, however, changed the course of financial history. Before 2008, QE was a ‘guinea pig’ only ever implemented in Japan from 2001 to 2006. Since then, the likes of the Bank of England, European Central Bank and the Swiss National bank have all launched their own versions of QE. With growing literature and data, especially with the US-led QE4, understanding the opportunities and dangers presented by QE is ever so relevant for market players today.
Outlooks in June 2024

Note: Consumer Price Index (CPI) showed no increase in May, holding flat on the month.
There is no doubt that the Fed is taking a conservative and cautious approach to lowering rates. Even with the Bureau of Labor Statistics’ CPI for May exceeding almost everyone’s expectations, Powell stated that the data was ‘progress’ and ‘building confidence’ but ‘we don’t see ourselves as having the confidence that would warrant beginning to loosen policy at this time’.
Fundamentally, the Fed does not need to rush with rate cuts. In 1980, there was 2 successive recessions prompting Volcker to rush rate cuts. Today, the economy is strong enough (at least for now) to afford Powell time to wait for more conclusive inflation data before cutting rates.

Note: Comparison between March & June Fed Dot Plots showing where top Fed policymakers believe the federal funds rate is headed.
Over this summer, it is expected that more data, like the core PCE deflator, will further echo the latest CPI report. Considering the Fed’s conservative stance and the fact that the numbers are moving in the right direction, but not as fast as the rigorous market reactions would suggest, September could see the first and only rate cut of 2024. Following that, we can expect a series of rate cuts through 2025, as echoed by the Fed dot projections.
Ultimately, the speed of Fed rate cuts depend on how strong future economic data is, which is hard to gauge. However, what is far easier to ascertain is that market optimism now, is unbridled by Fed conservatism. This, along with a conclusive start to the transition towards lower long-term rates, provides myriad opportunities for market players.


Comments