Factor Investing: A factor-based approach to investing & portfolio construction
- Aug 3, 2024
- 11 min read
By Keith Heng, 28th May 2024
As of December 2022, factor-based strategies amassed more than $1.8 trillion in assets. Understanding how they work can provide insights to investment management. This paper presents an overview of factor investing, including – (1) a brief history of factor investing, (2) key factors, (3) factor cyclicality, (4) factor-based portfolio construction, and (5) smart beta ETFs.
The rise of factor investing
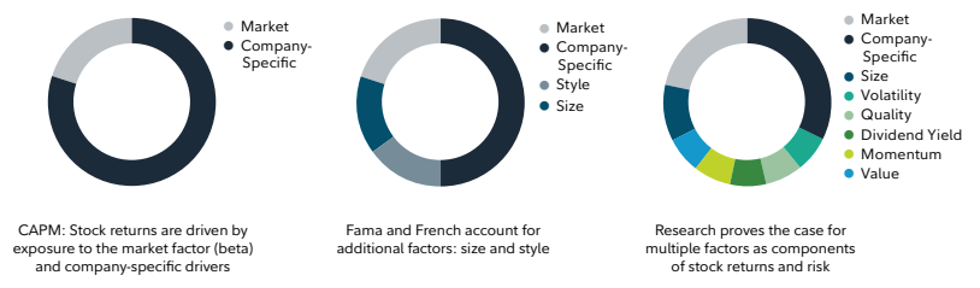
Factors are any broad, persistent drivers of return shown by research to be historically enduring. The early 1960s saw the advent of the Capital Asset Pricing Model (CAPM), which posited that every security had varying exposures to broader market movements, measured by beta. This formulation was the first basic, one-factor model where a single factor – market exposure – drives security risk and returns.
Note: Factor investing has evolved over time, with research & data supporting a wide variety of factors, under varying economic circumstances
Source: Fidelity Investments
Over time, research by academic and industry practitioners expanded the collection of factors that could potentially drive stock returns. For instance, Ross’s Arbitrage Pricing Theory (APT) in 1976 extended CAPM to a multifactor approach while others, like Eugene Fama & Kenneth French demonstrated that factors like company size and valuation might drive superior returns over time. Other factors that have come to prominence include – but are not limited to – momentum, volatility, and value.

Note: Smart Beta ETFs employing enhanced indexing that capitalise on certain factors have been growing in popularity.
Today, factors can be broadly categorised into (1) macroeconomic factors, which capture broad risks across asset classes, and (2) style factors, which help to explain returns and risk within asset classes. Investors employing factor-based strategies could be looking to improve portfolio outcomes, reduce volatility, or enhance diversification. Most notably, smart-beta ETFs have become highly popular as a middle-ground between passive and active investing, amassing close to $500 billion in assets as of end-2022.
Notable factors
Factor investing can be complex due to the wide range of factors that exist. With that being said, the following six factors – which are amongst the most widely researched and adopted – provide an apt starting point to designing factor-based strategies.
To illustrate these factors, we make reference to Fidelity Investment's — An Overview of Factor Investing. The exact methodology in Fidelity's paper can be replicated using data from free financial APIs (my personal choice is Alpha Vantage) as per the detailed methodology described in the appendix (also provided at the bottom of this paper). Using the same method, one can also experiment with different indexes such as the Nasdaq-100 or modify the factor implementation methods.
Here, the Russell 1000 Index is used as a benchmark for the ‘broader market’. Then, each factor is implemented through a single-factor portfolio formed by the equal-weighted top/bottom quintile of the Russell 1000 Index ordered by metrics relevant to that factor.
For instance, a dividend-yield factor portfolio would be the equal-weighted top quintile of the Russell 1000 Index by average dividend yield. Then, the performance of each factor is measured from 1/1/1986 to 31/31/2023. An overview of the results are shown below, which subsequent explanations reference.
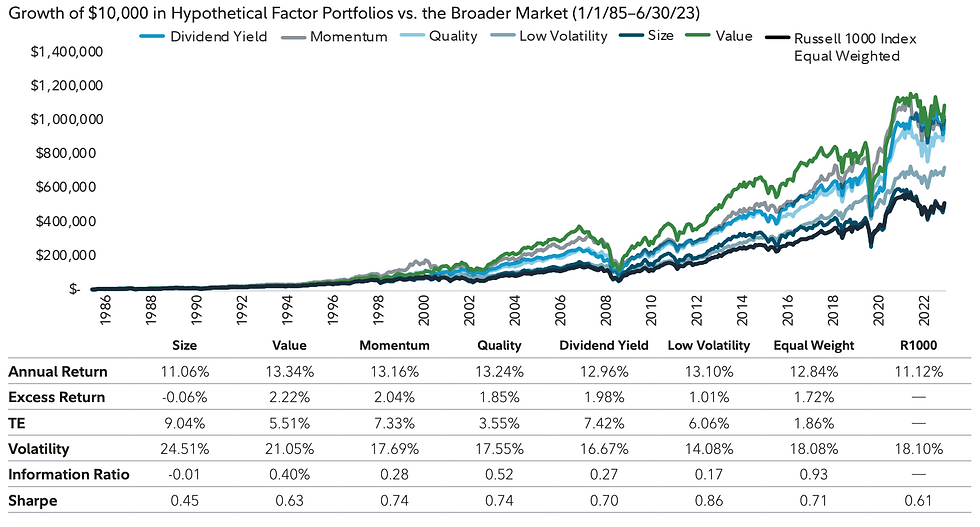
Note: Performance of the 6 key factors mentioned in this paper. Excess returns are annualised. Hit rate shows historical frequency of outperformance. Volatility measured by standard deviation.
(1) Size

Note: Relative Strength line indexed at 100 at start of 1931/ Small-cap stocks (Russell 2000 Index) vs large-cap stocks (Russell 1000 Index) for years 1979 to 2023. The dark blue line shows the cumulative average annual outperformance (or underperformance) of small-cap stocks over large-cap stocks in basis points. The light blue and light orange lines indicate periods where one was dominant over the other.
Source: Wellington Management
In 1976, Fama and French demonstrated that return premiums existed for investing in smaller cap stocks. Historically, over long-time periods, small-cap stocks have indeed outperformed larger-cap stocks. This could be due to their higher volatility and ability to grow more rapidly in favourable economic climates. Exposure to small cap stocks can be created using standard market capitalisations or through small-cap ETFs, like the Vanguard Small-Cap ETF, which provide straightforward ways to create diversified, small-cap holdings.
The single-factor size portfolio, created by taking the equal-weighted bottom quintile – by market capitalisation – of the Russell 1000 Index, performed roughly the same as the broader market, with more than 6% volatility.

Note: Cyclicality matters! Factors are not all-weather and have been shown to perform differently in varying economic cycles.
Source: Morningstar
At this point, the obvious question is – haven’t small-cap stocks been underperforming in recent years? That is absolutely true, which reflects a key characteristic of factors – cyclicity (explained in greater detail later). No factor has worked consistently through all historical periods. The same volatility that allows small-cap stocks to earn more in bull markets also increases proclivity to losses during bearish runs. This cyclicality is crucial when thinking about factors.
(2) Value
Another factor identified by Fama and French was value. Value investing involves fundamental analysis to target stocks that trade at a discount to their intrinsic value. Obviously, value investing is an entire art-form by itself. Here however, a basic exposure to ‘value’ can be created through selecting stocks with low price-to-book (P/B) ratios, low price-to-earnings (P/E) ratio or low price-to-cash flow (P/CF) ratio.
The single-factor value portfolio, created by taking the equal-weighted top quintile – by combined average ranking of book/price ratio and earnings yield – of the Russell 1000 Index, created excess returns of 2.22% over time. Though, it is close to 3% more volatile than the broader market.
(3) Momentum
Momentum is perhaps, the most ‘notorious’ of all factors on account of its raw simplicity. In 1993, Jegadeesh and Titman demonstrated that stocks that perform well in the last 3 to 12 months tend to continue performing well in the next 3 to 12 months – hence the momentum. As simple as this sounds, a vast array of empirical evidence has supported the idea that buying previous winners and shorting previous losers can drive excess returns.
There exists huge debate as to why momentum works, the conditions under which it falters and how best to time it. The single-factor momentum portfolio, created by taking the equal-weighted top quintile – by trailing 12-month returns – of the Russell 1000 Index, outperformed the broader market by 2.04%, with roughly similar volatility.
(4) Quality
Quality is hard to define, despite being an age-old investing concept. Sloan and Richardson suggested that companies with higher earnings quality and lower accruals (measured by the difference between operating cash flow and net income) tend to outperform the market. Others believe that higher profitability, stable income and cashflow streams, and a lack of high leverage are defining traits of quality stocks.
The single-factor quality portfolio, created by taking the top quintile – by return on equity – of the Russell 1000 Index, outperformed the broader market by 1.85%, with roughly similar volatility to the broader market.
(5) Dividend Yield
Historically, stocks with higher yields have provided superior returns over time. This ‘yield’ factor also exists across asset classes and is often referred to as ‘carry’ when applied to fixed income or currencies. A large number of academics, such as Edwin Elton and Joel Rentzler, have found consistent relationships between dividend yield and excess returns. Referring to the previous chart, a dividend yield portfolio created by taking the equal-weighted top quintile of Russell 1000 index (by dividend yield) outperformed broader market in the long-run.
The single-factor dividend yield portfolio, created by taking the equal-weighted top quintile – by dividend yield – of the Russell 1000 Index, created excess returns of 1.98% over time.
(6) Low Volatility
Lastly, stocks with lower risk or return volatility than the broader market have historically had better risk-adjusted returns. Some research has also demonstrated that low-volatility portfolios can outperform the broader market in the long-run. For instance, this Fidelity lecture by Robert Haugen and James Heins shows how stock portfolios with less monthly returns variance tend to outperform ‘riskier’ portfolios.
Notably, low-volatility approaches work best when markets fall rapidly as low-volatility stocks tend to be more defensive in bearish conditions with high market uncertainty. The single-factor dividend yield portfolio, created by taking the equal-weighted top quintile – by standard deviation of weekly price returns – of the Russell 1000 Index, created excess returns of 1.01% over time. Notably, it is about 4% less volatile than the broader market.
The cyclical nature of factors
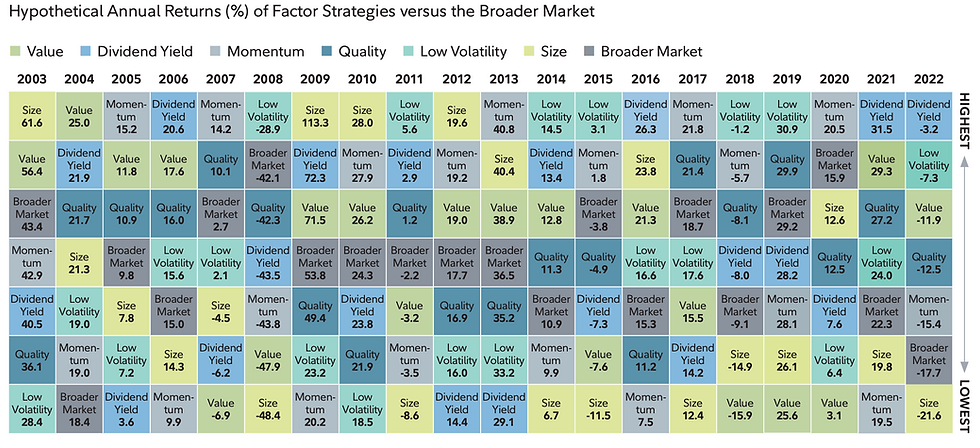
Note: Factors are cyclical. They perform well in some periods and poorly in others. Multi-factor strategies could offer diversification through changing business cycles and exposure to specific portfolio goals.
Source: Fidelity Investments
As mentioned previously, no single factor has worked in every market condition. Be it momentum, value or volatility – different factors have unique risks and perform well in varied market conditions.
Adding on to the previous example, small-cap stocks have outperformed large caps for certain periods such as the tech ‘bubble’ in the late 1990s and during the 2008 financial crisis. However, in other periods, such as in the recent heightened interest rate phase, they have lagged the growth of large-cap stocks. Momentum on the other hand, is often hard-hit by rapid market direction reversals, such as the tech bubble collapse in 2000 and rapid financial crisis recovery in 2009.

Note: Factors perform well in different market conditions. While small-cap stocks have lagged in recent years, they have outperformed significantly in other periods, such as following the 2008 Recession.
Source: The Motley Fool
Crucially, most factors are not substantially correlated with one another historically, and are driven by different market conditions and thus, drive returns (or losses) at different times. This cyclicality means that investors might be able to time their exposures to different factors through tactical asset allocations. This however, is immensely challenging.
Factor-based portfolio construction
More reasonably, the cyclicality and low correlation of factors means we can build well-diversified, multi-factor portfolios that target specific investment goals, such as superior risk-adjusted returns. This is achieved by primary portfolio allocation to factors that are most suited to the investment objective, and diversifying the remaining portfolio across different factors.
To illustrate this, we reference two other Fidelity papers — (1) Combining Factors to Target Specific Investment Outcomes, and (2) Putting Factors to Work — which utilise the same Russell 1000 Index factoring methods. In these papers, we look at multi-factor equity portfolios targeting (1) capital appreciation, (2) downside protection, and (3) income.
The performance of individual factors and their combined multi-factor portfolios (bottom four rows) are shown below. These results can similarly be replicated as per details in the appendix. However, more extensive research needs to be done to consider their actual feasibility in the current market cycle. Subsequent explanations reference these results.

Note: Multi-factor portfolios can be crafted to achieve specific goals, especially if factors are used in an ‘intentional manner’ with good understanding of its relation to deeper market cycles and timing.
Source: Fidelity Investments
(1) Capital Appreciation
Long-term investors aiming for capital appreciation seek equity returns that outperform the broader market over time. However, due to loss aversion, enduring short-term portfolio losses has been historically challenging. Therefore, a more apt approach to capital appreciation may be to seek better risk-adjusted returns rather than high absolute returns.
To achieve this, primary allocations can be given to value (25%) and momentum factors (25%), which historically display strong absolute and risk-adjusted returns. More importantly, value and momentum diversify one another – since they have been negatively correlated historically. Additionally, substantial allocation to quality (20%) – compromising companies with consistent income, cashflows and profitability – can contribute to both risk-adjusted returns and performance consistency. Lastly, the remaining portfolio can be further diversified amongst other notable factors (10% each).

Note: Capital appreciation portfolio optimised for superior risk-adjusted returns as compared to the broader market given by equal-weighted Russell 1000 Index.
The capital appreciation portfolio achieves 1.9% excess returns with superior risk-adjusted returns, shown by information ratio of 1.12, which is significantly higher than other portfolios – including the purely equal-weighted portfolio.
(2) Downside Protection
Many risk-averse investors are primarily driven by cutting portfolio risks. All-weather funds, pension funds or retirement investors tend to do this by allocating large parts of their portfolio to fixed-income instruments. In the case of an equity-only portfolio, downside protection can be achieved by making low-volatility stocks the primary allocation (45%). Then, we can diversify the remaining portfolio amongst the other key factors (10% to 15% each).

Note: Downside protection portfolio achieves small excess returns over benchmark while reducing volatility.
Most importantly, the excess returns of the downside protection portfolio during down periods were close to 3% higher than that of the capital appreciation portfolio and its worst 12-month return was close to 5% higher than that of the capital appreciation and subsequent income portfolio.
Although it failed to outperform the broader market when looking only at up periods, it remains a highly attractive strategy during bearish periods. Considering its cyclicality, such a portfolio can be implemented and timed using leading economic indicators that forecast market downturns.
(3) Income
Closely related to a downside protection portfolio, some investors entering retirement might prioritise regular income from their portfolios. Coincidentally, high dividend yield is by itself a factor that drives excess capital returns. Thus, by making dividend yield the primary allocation (45%) and diversifying the remaining portfolio across the other factors (10% to 15% each), we can achieve a high average dividend-yield while maintaining a good risk-adjusted ratio.

Note: Income portfolio is intended to help investors achieve a high average dividend yield while continuing to outperform the broader market and diversify for better risk-adjusted returns.
The income portfolio generates excess returns of 1.9% over the broader market. Most importantly, it achieves 3.6% average dividend yield.
Smart-Beta ETFs
Today, smart beta ETFs are amongst the most popular forms of factor investing. These ETFs are a blend of passive and active investing – using systematic, factor-based approaches to choose stocks from a particular index. For instance, a value ETF might take general indexes like the S&P 500 and tailor holdings based on predetermined value metrics or simply replicate existing indexes in this area.

Note: Return performances of the Vanguard Value ETF that tracks the performance of the CRSP US Large Cap Value Index, which measures investment returns of large-cap value stocks
Source: Vanguard Value ETF
One example is the Vanguard Value ETF that tracks the investment performance of the CRSP US Large Cap Value Index. The CRSP Value Index in turn, classifies value securities using a wide range of factors from book-to price, forward earnings to price, earnings to price and dividend-to-price ratio. Since its inception in 2004, it has achieved 9.68% annualised returns.
Concluding Thoughts
Factor investing has become more prevalent in the past two decades, with a vast body of literature analysing factors and factor-based portfolio construction from different angles. The difficulty in factor investing – is not only the wide factors that are available at hand to consider – but that even seemingly simple factors like ‘momentum’, are fraught with debate on how they can be best utilised. Ultimately, the cyclicality of factors mean that investors have to try to get a holistic understanding of the drivers of different factors, take into account the specific investment goals and economic conditions they operate in, and construct nuanced strategies.
Appendix
Methodology
All individual factor portfolios are equal weighted and are compared to an equal-weighted benchmark in an effort to capture pure factor exposures and eliminate unintended exposures, such as size bias. Factor portfolios are also sector neutral. Factor portfolios and indexes assume the reinvestment of dividends, exclude investment fees, implementation and rebalancing costs, and taxes, and were rebalanced monthly. Size (small cap) returns are annualized returns of the equal-weighted bottom quintile (by market capitalization) of the Russell 1000 Index. Value composite returns shown are annualized returns of a combined average ranking of stocks in the equalweighted top quintile (by book/price ratio) and stocks in the equal-weighted top quintile (by earnings yield) of the Russell 1000 Index. Momentum returns are annualized returns of the equal-weighted top quintile (by trailing 12-month returns) of the Russell 1000 Index. Quality returns are annualized returns of the equal-weighted top quintile (by return on equity) of the Russell 1000 Index. Return on equity is a measure of profitability that calculates how many dollars of profit a company generates with each dollar of shareholders’ equity. Low-volatility returns are annualized returns of the equal-weighted bottom quintile (by standard deviation of weekly price returns) of the Russell 1000 Index. Standard deviation is a measure of return dispersion. A portfolio with a lower standard deviation exhibits less return volatility. Dividend yield returns are annualized returns of the equal-weighted top quintile (by dividend yield) of the Russell 1000 Index.
Glossary of Terms
Excess return: Return relative to the broader market (in this case, the equal-weighted Russell 1000 Index). A positive excess return denotes outperformance.
Hit rate: Also known as a batting average, hit rate measures the percentage of historical monthly periods over which a portfolio outperformed the benchmark.
Information ratio: A measure of risk-adjusted return that assesses a portfolio’s returns in excess of a benchmark compared to the volatility of those excess returns, or tracking error. A higher information ratio denotes better risk-adjusted returns.
Standard deviation: A statistical measure of how much a portfolio’s return varies over time. The more variable (volatile) the returns, the higher the standard deviation.


Comments